Cryptocurrency has become a hot topic in recent years, with Bitcoin being the most well-known and widely used. As more people are becoming interested in investing in Bitcoin, it is important to understand how to read Bitcoin charts in order to make informed decisions. In this blog post, we will provide an in-depth guide on how to read Bitcoin charts, including live analysis, historical trends, and trading strategies.
Bitcoin Chart Overview
Before diving into the details of reading Bitcoin charts, it is important to understand what exactly a Bitcoin chart is and how it works. A Bitcoin chart is a visual representation of the price movement of Bitcoin over a specific period of time. It shows the opening, closing, high, and low prices of Bitcoin for each day, week, month, or year.
There are various types of Bitcoin charts, but the most commonly used ones are line charts, bar charts, and candlestick charts. Line charts show the closing price of Bitcoin over a specific period of time, while bar charts display the high, low, and closing prices. Candlestick charts are the most popular type of chart among traders as they provide a more detailed view of price movements.
Live Bitcoin Chart Analysis
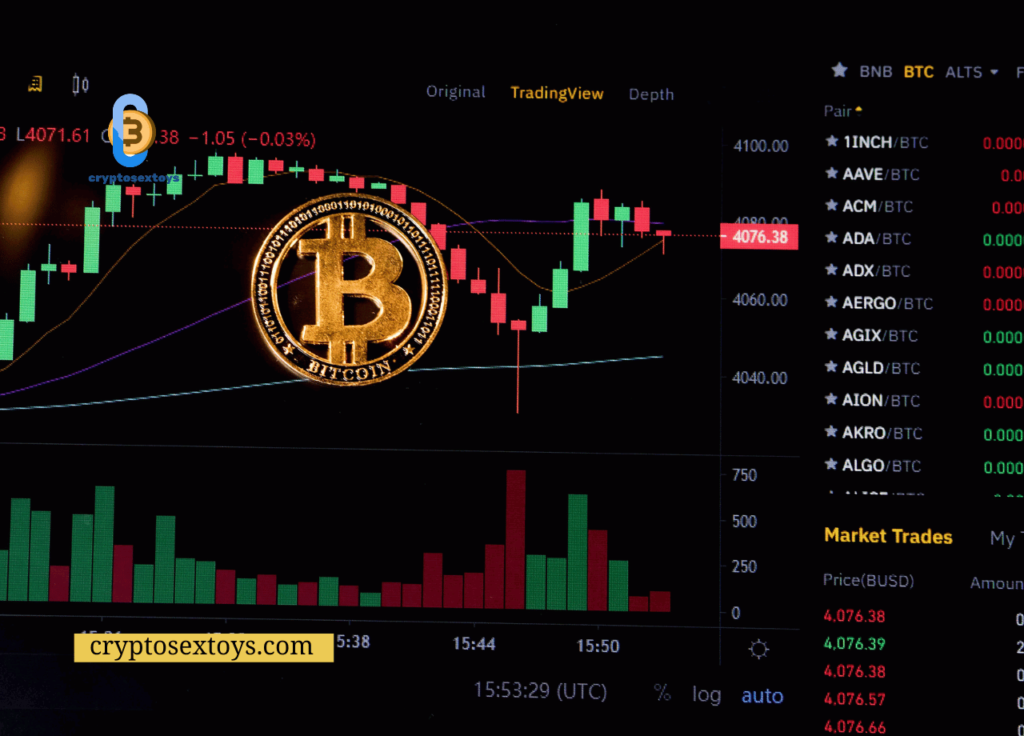
One of the best ways to understand how to read Bitcoin charts is by analyzing them in real-time. There are many websites and platforms that offer live Bitcoin charts, such as Tradingview, Coinbase, and Binance. These charts provide real-time data and allow users to customize their viewing preferences.
When analyzing a live Bitcoin chart, it is important to pay attention to the time frame, which can range from 1 minute to 1 month. The shorter the time frame, the more volatile the price movements will be. Traders often use shorter time frames to make quick trades, while long-term investors tend to focus on longer time frames.
Another important aspect to consider when analyzing a live Bitcoin chart is the volume. Volume refers to the number of Bitcoin being traded within a specific time frame. High volume usually indicates strong market interest and can be a sign of potential price movements.
Bitcoin Chart History: All Time Highs and Lows
Bitcoin has had a tumultuous history, with extreme highs and lows in its price. Understanding the historical trends of Bitcoin can help investors make more informed decisions when trading or investing. Let’s take a look at some of the all-time highs and lows of Bitcoin and how they are reflected on the charts.
Bitcoin Chart Tradingview
Tradingview is a popular platform for traders and investors to analyze charts and make trades. It offers a wide range of tools and indicators to help users analyze the market. One of the most useful features of Tradingview is the ability to view Bitcoin charts from different exchanges, such as Binance, Coinbase, and Bitfinex.
By comparing Bitcoin charts from different exchanges, users can get a better understanding of the overall market sentiment and make more accurate predictions. Additionally, Tradingview also allows users to overlay different indicators on the chart, such as moving averages and Bollinger bands, to further analyze price movements.
Analyzing Bitcoin Chart Trends
As with any investment, it is important to analyze trends in order to make informed decisions. When looking at a Bitcoin chart, there are a few key trends to pay attention to:
- Upward trend: An upward trend on a Bitcoin chart indicates that the price is increasing over time. This can be a good opportunity for investors to buy and hold Bitcoin for potential long-term gains.
- Downtrend: A downtrend on a Bitcoin chart shows that the price is decreasing over time. This could be a sign of potential losses for investors and may be a good time to sell or avoid buying.
- Sideways trend: A sideways trend on a Bitcoin chart means that the price is relatively stable and not showing significant movements in either direction. This could be a good time for traders to make short-term trades, but may not be ideal for long-term investors.
| Next Up In Investing |
| How Does Bitcoin Work |
| How Many Bitcoins for a Dollar? |
How to Read Bitcoin Charts on Tradingview
As mentioned earlier, Tradingview offers real-time Bitcoin charts that are constantly updating with the latest price data. This allows users to track price movements and make quick decisions based on market trends. Additionally, Tradingview also offers a feature called “Social” where users can interact with other traders and share their analysis of the market.
The real-time Bitcoin chart on Tradingview also allows users to draw trend lines and add annotations, making it easier to identify patterns and potential price movements. Traders can also set alerts for specific price levels, which can help them stay on top of the market and make timely trades.
Bitcoin Chart in Indian Rupees
Bitcoin is a global currency, and its value is often compared to major fiat currencies such as the US dollar and the Euro. However, it is also important to understand how Bitcoin’s price is reflected in other currencies, such as the Indian rupee (INR).
There are many websites and platforms that offer Bitcoin charts in INR, including Tradingview, CoinMarketCap, and Coindesk. These charts show the price of Bitcoin in INR over different time frames, allowing users to analyze the market and make informed decisions.
Bitcoin Chart in Australian Dollars
Similar to the INR, the Australian dollar (AUD) is another fiat currency that is often used to compare Bitcoin’s value. As Australia has a growing interest in cryptocurrency, it is important for investors to understand how Bitcoin’s price is reflected in AUD.
There are various platforms that offer Bitcoin charts in AUD, such as CoinSpot, BTC Markets, and Independent Reserve. These charts allow users to analyze the market and make trades in their local currency.
Using the Rainbow Bitcoin Chart
The Rainbow Bitcoin chart is a unique way of visualizing the price movements of Bitcoin. It was created by blockchain developer and analyst Willy Woo, and it has gained popularity among traders and investors.
The Rainbow Bitcoin chart uses different colors to represent different moving averages, ranging from 200 days to 50 days. When these moving averages converge, it is seen as a bullish signal, while diverging moving averages indicate a bearish trend. This chart can be useful for identifying long-term trends and potential entry and exit points for trades.
Bitcoin Chart Since 2009: Evolution of the Cryptocurrency

Bitcoin was first introduced in 2009, and its price has gone through many ups and downs since then. Understanding the evolution of Bitcoin’s price over the years can provide valuable insights for investors.
In 2010, Bitcoin’s price was less than $1, and it remained relatively stable until 2013 when it reached an all-time high of $1,242. However, this was followed by a major crash, and Bitcoin’s price dropped to around $200 in 2015. From there, Bitcoin’s price slowly started to climb again, reaching another all-time high of nearly $20,000 in 2017.
Since then, Bitcoin’s price has been volatile, with highs and lows that have attracted both investors and skeptics. In 2020, Bitcoin’s price saw a significant increase, reaching over $40,000 in January 2021. As of August 2021, Bitcoin’s price is hovering around $45,000.
Conclusion
In conclusion, understanding how to read Bitcoin charts is crucial for anyone interested in investing in cryptocurrency. By analyzing live charts, historical trends, and using tools such as Tradingview, investors can make more informed decisions and potentially maximize their profits. It is important to remember that Bitcoin is a highly volatile asset, and careful research and analysis should always be done before making any investment decisions.
